Section 3.3.
We work with the data in Hadpas. This data consists of several resistance
measurements in ohms of 5 types of resistances.

MTB > Retrieve  'A:\HADPAS.MTW'.
Retrieving worksheet from file: A:\HADPAS.MTW
First, we code the data
MTB > code (2500:2300)5 (2100:2300)4 (1900:2100)3 (1700:1900)2 (1500:1700)1
c4 c14
MTB > code  (2100:2300)5 (1900:2100)4 (1700:1900)3 (1500:1700)2 (1300:1500)1
c7 c17
Next, we get the table of joint frequency distribution of Res3 and Res7.
MTB > table c14 c17
 ROWS: C14     COLUMNS: C17

           1        2        3        4        5      ALL

  1        1       12        1        0        0       14
  2        0       15       28        3        0       46
  3        0        2       43       41        2       88
  4        0        0        5       32        6       43
  5        0        0        0        0        1        1
 ALL       1       29       77       76        9      192

  CELL CONTENTS --
                  COUNT
This table is in Table 3.2 in the textbook. We can find the means and
standard deviation of the variable Res3 by doing groups using Res7.

MTB > descr c4;
SUBC> by c17.

              C17        N     MEAN   MEDIAN   TRMEAN    STDEV   SEMEAN
RES3            1        1   1600.0   1600.0   1600.0        *        *
                2       29   1718.9   1707.0   1716.6     80.3     14.9
                3       77   1932.9   1934.0   1930.2    101.2     11.5
                4       76   2068.5   2067.0   2071.3     99.7     11.4
                5        9   2204.0   2200.0   2204.0    115.5     38.5

              C17      MIN      MAX       Q1       Q3
RES3            1   1600.0   1600.0        *        *
                2   1587.0   1914.0   1667.0   1760.0
                3   1680.0   2180.0   1860.0   1997.0
                4   1800.0   2267.0   2000.0   2145.2
                5   2040.0   2427.0   2104.0   2273.5

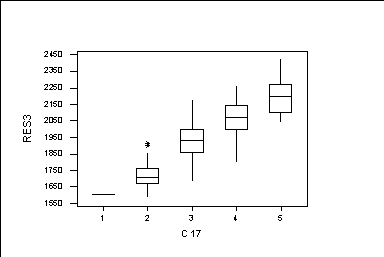
We also can find the boxplot for each group
MTB > boxplot c4*c1


We see that if  c17 increases, then Res3 also increases.

There are several subcommands which we can use with the command table
such as RowPercents; ColPercents; TotPercents. For example, next, we find
the column percentages.
MTB > Table C14 C17;
SUBC>   ColPercents.

 ROWS: C14     COLUMNS: C17

           1        2        3        4        5      ALL

  1   100.00    41.38     1.30      --       --      7.29
  2      --     51.72    36.36     3.95      --     23.96
  3      --      6.90    55.84    53.95    22.22    45.83
  4      --       --      6.49    42.11    66.67    22.40
  5      --       --       --       --     11.11     0.52
 ALL  100.00   100.00   100.00   100.00   100.00   100.00

  CELL CONTENTS --
                  % OF COL

The column frequencies are also called conditional frequencies.
This table is in page 55 of the textbook.


