Section 6.6.
The command %normplot obtains the normal plot of the variable. For example:
MTB > Retrieve 'C:\ISTAT\CAR.MTW'.
Retrieving worksheet from file: C:\ISTAT\CAR.MTW
MTB > %NormPlot c3
Executing from file: C:\MTBSEW\MACROS\NormPlot.MAC
Macro is running ... please wait
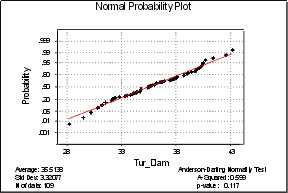
gives the following graph:
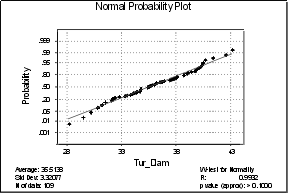
We also can find the normal plot and do the Shapiro-Wilks test by doing
MTB > %NormPlot c3;
SUBC> SWTest.
Comments to: Miguel A. Arcones
