MATH. 341. Test No. 1. October 1, 1999.
Name: Miguel A. Arcones

Answer all Questions.

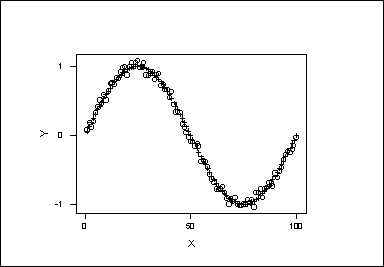
1. The following graph shows a sample of 100 observations.
What can you say about the structure of these observations?


Answer: There exists a very strong functional relation between the variables
X and Y. The relation is a sinuosidal relation: y=a sin(bx)+random component.
The random component has a small variance.

2. How many samples of n=10 observations are there, if the population
consists of N=100 items, when sampling is

(i)	RSWR ?
(ii)	RSWOR ?

Answers:
(i) Nn=10010=1020
(ii) N(N-1)· · · (n-n+1)
=100· 99· 98· 97· 96· 95·
94· 93· 92 ·91=6.28 · 1019
which is slightly smaller than the previous number.

3. The following is the frequency distribution of the number of
blemishes, X, in a sample of size n=100 of ceramic plates purchased for
hybrid microelectronic components.

ROWS: Nu_Blem.


 X        f              p             P
______________________________________________________________________
  0        2
  1        8
  2       17
  3       17
  4       22
  5        8
  6       18
  7        4
  8        1
  9	   3
 10	   0


ALL     100


a) Complete the above table by computing the column of proportional
frequencies, p,and cumulative proportional frequencies, P.

b) What proportion of ceramic plates in the sample have at
least 1 blemish?

c) What proportion of sample plates have between 3 and 7 blemishes?

Answer:

(a)
|
X |
f |
p |
P |
|
|
|
|
|
0 |
2 |
0.02 |
0.02 |
|
1 |
8 |
0.08 |
0.10 |
|
2 |
17 |
0.17 |
0.27 |
|
3 |
17 |
0.17 |
0.44 |
|
4 |
22 |
0.22 |
0.66 |
|
5 |
8 |
0.08 |
0.74 |
|
6 |
18 |
0.18 |
0.92 |
|
7 |
4 |
0.04 |
0.96 |
|
8 |
1 |
0.01 |
0.97 |
|
9 |
3 |
0.03 |
1.00 |
|
10 |
0 |
0.00 |
1.00 |
|
|
|
|
|
|
ALL |
100 |
1.00 |
1.00 |
(b) The proportion of ceramic plates in the sample which have at
least 1 blemish is 1-0.02=0.98.

c) The  proportion of sample plates which have between 3 and 7 blemishes is
0.17+0.22+0.08+0.18+0.04=0.69.


4. In the YarnStrg data there are n=100 values. The following are some
of theordered values:
	X(25) = 2.2762
	X(26) = 2.2872
	X(50) = 2.8243
	X(51) = 2.8418
	X(75) = 3.5272
	X(76) = 3.5886

Compute the first quartile Q1, the Median Me, and the third
quartile Q3.


Answer:

Q1 = X((n+1)/4)=X(25.25)
=(1-.25)X(25)+(.25)X(26)
=(1-.25)2.2762+(.25)2.2872=2.27895

Me =X((n+1)/2)=X(50.5)
=(1-.5)X(25)+(.5)X(26)
=(1-.5)2.8243+(.5)2.8418=2.83305

Q3=X((3(n+1)/4)=X(75.75)
=(1-.75)X(38)+(.75)X(39)
=(1-.75)3.5272+(.75)3.5886=3.57325


5. The following are the descriptive statistics of the steelrod  data file:


	Descriptive Statistics


	Variable        N     Mean   Median   TrMean    StDev   SEMean
	SteelRod       50   19.890   19.813   19.893    1.123    0.159

	Variable      Min      Max       Q1       Q3
	SteelRod   17.388   22.400   19.160   20.628


Answer the following questions:


(a) If the two largest observations in the data set will be increased
by 10 each, what  will be the value of the TrMean ?

(b)  What will be the value of the sample mean if the minimal value
in the sample will be changed to 15 ?

(c)  What is the value of the sample variance?

(d)  How many observations lie between Q1 and Q3 ?

(e)  Are there outliers in the sample? Justify your answer.


Answer:

(a) Nothing. The trimmed is found removing the 5% smallest and 5%
biggest observations.   5% of 50 is 2.5.

b) New Mean =2.931122
We change the  minimum from 17.388 into 15. So, the sum of the observations
is decreased by 17.388-15=2.388.
The average, which is the sum of the observations over n, is decreased by
2.388/50=0.04776.
So, the new mean is 19.890-0.04776=19.84224


c) s2=1.261129
The sample variance is the square of the standard deviation, in this case
1.1232=1.261129

d) 50 % of the observations= 25 observations.

e) Outliers are values outside the interval determined
by the lower and upper limits:

Lower Limit:   Q1 - 1.5 (Q3 - Q1)=19.160-1.5(20.628-19.160)=16.958

Upper Limit:   Q3 + 1.5 (Q3 - Q1)=20.628-1.5(20.628-19.160)=22.83

Since the minimum is 17.388 and the maximum is 22.400,
there is no outliers in the sample.


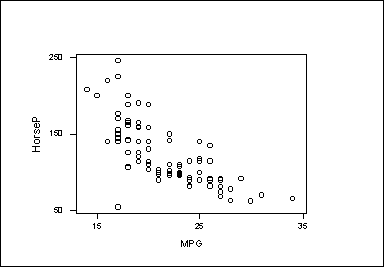
6. The plot below presents the scatterdiagram of the variables:
	X: MPG
	Y: Horse-Power
In the CAR data.


(a) Is the correlation between these two variables positive or negative?

(b)The means and standard deviations of HorseP and MPG and their covariance
are:

	 Mean of MPG   = 21.486

	 Standard deviation of MPG  = 3.9172

	 Mean of HorseP  = 124.67

	 Standard deviation of HorseP  = 40.162

	 Covariance of MPG and HorseP = -118.781


What are the intercept and slope of the regression line of HorseP on MPG?

(d) What is the predicted value of HorseP for a car having MPG= 21.6?


Answers:

a) Since the covariance is negative, the correlation  is also negative.


b)  Intercept =290.992524; Slope =-7.74097

We have that b=Sx,y/Sx2=-118.781/(3.91722)=-7.740972

a="y-bar"-b"x-bar"-=124.67-((-7.740972)*21.486)=290.992524

c)   Predicted HorseP =123.7875724
The least squares regression line is y=290.992524-7.74097 x.
So, the Predicted HorseP when MPG= 21.6 is
290.992524-(7.74097*21.6)=123.7875724.


