MATH. 341. Test No.1. Solutions.
October 2, 2000
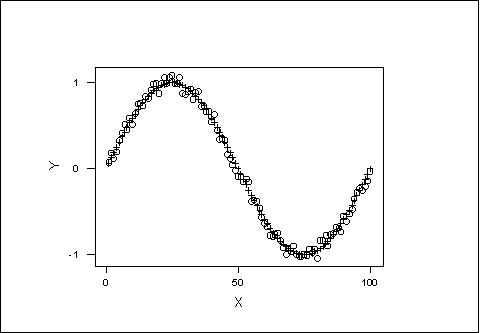
Instrument 1
Instrument 2
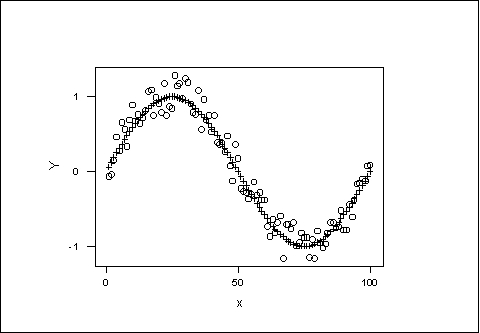
Which one of the two instruments is more precise? (justify your answer).
Answer:
Instrument 1 is more precise. According to the graphs,
the dispersion
of E in instrument 1 is smaller than that of instrument 2.
2. (10 points). The variables X1 , X2 ,..., X10 can each assume the values 0 or 1.
(i) How many possible binary signals are there, consisting of 5 of these
variables?
(ii) How many binary signals of 10 variables have exactly 3 1s?
Answer:
(i) 25=32
(ii) C103=120
3. ( 15 points). The following is the frequency distribution of the
Turn Diameter in the Car data
| X | f | p | P |
| 28-30 | 3 | 0.0275 | 0.0275 |
| 30-32 | 16 | 0.1468 | 0.1743 |
| 32-34 | 16 | 0.1468 | 0.3211 |
| 34-36 | 26 | 0.2385 | 0.5596 |
| 36-38 | 20 | 0.1835 | 0.7431 |
| 38-40 | 18 | 0.1651 | 0.9082 |
| 40-42 | 8 | 0.0734 | 0.9816 |
| 42-44 | 2 | 0.0184 | 1.0000 |
| ALL | 109 | 1.00 | 1.00 |
a) Complete the above table by computing the column of proportional
frequencies, p, and cumulative proportional frequencies, P.
b) What proportion of cars have Turn Diameter between 35 and 39,
inclusive?
(interpolate if necessary)
c) Estimate the first, second and third quartiles.
Answers:
( b ) By interpolation
( c ) With X=32, we only get 17.43 % of the observations, with X=34,
we get 32.11% of the observations.
We need to increase the cumulative frequency by a percentage
of (.25-.1743)/(.3211-.1743).
Q1=32+2(.25-.1743)/(.3211-.1743)=33.20
Similarly
Me=34+2(.50-.3211)/(.5596-.3211)=35.5
Q3=38+2(.75-.7431)/(.9082-.7431)=38.08
13 observations are in the interval (35,36];
20 observations are in the interval (36,38];
09 observations are in the interval (38,40].
So, the proportion of observations in the interval (35,39] is (13+20+9)/109=.3853
Since, we are increasing two units from X=32 to X=34, we have that
4. ( 15 points). In the YarnStrg data there are n=100 values. The following is the stem-leaf diagram of the data.
Stem-and-leaf of Yarn-Str N = 100
Leaf Unit = 0.10
5 1 11344
15 1 5556677788
34 2 0011112222233344444
(21) 2 555555555566677888999
45 3 000011112223344444
27 3 5556666677789
14 4 00013344
6 4 5668
2 5 0
1 5 7
Compute the first quartile Q1, the Median Me, and the third quartile Q3.
Answer:
Q1 = X((n+1)/4)
=X(25.25)=(.75)X(25)
+.25X(26)=2.2
Me = X((n+1)/2)=X(50.5)
=(.5)X(50)+(.5)X(51)
=2.28
Q3= X((3/4)(n+1))
=X(75.75)=(.25)X(75)
+(.75)X(76)=3.5
5. ( 25 points). The following are the descriptive statistics of the
steelrod data file:
Descriptive Statistics
Variable N
Mean Median TrMean StDev
SEMean
SteelRod 50 19.890
19.813 19.893 1.123 0.159
Variable Min
Max Q1
Q3
SteelRod 17.388 22.400 19.160
20.628
Answer the following questions:
a) If the five largest observations in the data set will be increased
by 10 each, what will be the value of Q1
and
of Q3 ?
Answer:
a) Since Q1=X(12.75) and
Q3=X(38.25),
the values of Q1 and Q3 after
changing the five largest observations are the same as before. Q1=19.160
and Q3=20.628
b) New Mean = the total sum is 994.5. If we remove the max which is
22.4 we are left with 972.1. The average for the left observations is 972.1/49=19.8387
c) IQR= Q3-Q1=20.628-19.160=1.468
d) number of observations larger than Q1 =50-12=38. Since
Q1= X(12.75), there are 12 observations smaller than
Q1 and 50-12=38 observations bigger than Q1.
e) The lower limit is Q1-1.5 IQR=16.958 and the upper limit is
Q3+1.5 IQR=22.83. Since the lower limit is smaller than the
minimum and the upper limit is bigger than
the maximum, there is no outliers.
b) What will be the value of the sample mean if the largest value in
the sample would be trimmed ?
c) What is the value of the inter-quartile range?
d) How many observations are greater than Q1 ?
e) Are there outliers in the sample? Justify your answer.
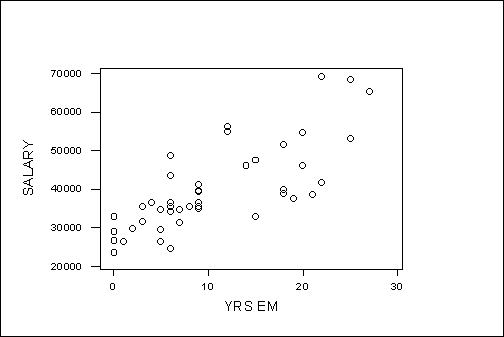
6. ( 25 points).The plot below presents the scatter diagram of
the variables:
X: years of employment
Y: salary
for 46 employees in the company Technitron in 1995.
The means and standard deviations of years of employment and salary and their covariance are:
Mean of "years of employment" = 10.33
Standard deviation of "years of employment" = 7.60
Mean of "salary" = $39,827
Standard deviation of "salary" = $10,999
Covariance of "years of employment" and "salary" = 63,975
a) What are the intercept and slope of the regression line of salary on years of employment?
b) What proportion of the total variability in salary is explainable by the linear regression of salary on years of employment?
c) What is the predicted value of salary for a person having 10 years of employment?
d) How much salary increase should an employee expect in one year?
Answers:
a=y(bar)-bx(bar)=39827-(1,107.60)(10.33)=$28,385.49
Intercept =$28,385.49
The regression line is y=28,385.49+1,107.60x.
b) Rxy=Sxy/SxSy=
63,975/(7.60)(10,999)=0.7653
is the correlation between salary and years of employement.
c) Predicted salary in 10 years of employment is
d) The predicted salary increase in one year is $1,107.60
a) We have that b=Sx,y/Sx2
=63975/7.62=1,107.60 and
Slope =1,107.60 dollars/year
The proportion of the total variability in salary
explainable by the linear regression is Rxy2 =0.5857
y=a+bx =28,385.49+(1,107.60)(10)=$39,461.49