First, you need to have the Florida datafile in your directory. To simplify, the notation, you do:
> florida_read.table("/home/arcones/MySwork/florida.txt",header=T,sep=",")
> county_florida[,1]
> bush_ florida[,2]
> gore_florida[,3]
> browne_ florida[,4]
> nader_florida[,5]
> harris_ florida[,6]
> hagelin_ florida[,7]
To get the total for each candidate do:
>bush.tot_sum(bush)
>gore.tot_sum(gore)
>browne.tot_sum(browne)
>nader.tot_sum(nader)
>harris.tot_sum(harris)
>hagelin.tot_sum(hagelin)
> print(c(bush.tot, gore.tot,browne.tot,nader.tot,harris.tot,hagelin.tot))
[1] 2912790 2912253   16415   97488     562    2281
Bush is the candidate with more votes.
To get the county percentage for each candidate do:
flor_c(bush,gore,browne,nader,harris,hagelin)
florida2_matrix(flor,ncol=6,byrow=F)
apply(florida2,2,sum)
flor.perc_florida2/apply(florida2,1,sum)
bush.perc_flor.perc[,1]
gore.perc_flor.perc[,2]
browne.perc_flor.perc[,3]
nader.perc_flor.perc[,4]
harris.perc_flor.perc[,5]
hagelin.perc_flor.perc[,6]
To obtain the main numerical measure which describe the data, you do
>summary(bush.perc)
   Min. 1st Qu. Median   Mean 3rd Qu.   Max.
 0.3099  0.5014  0.549 0.5533  0.6156 0.7404

>apply(cbind(bush.perc,gore.perc,browne.perc,nader.perc,harris.perc,hagelin.perc),2,summary)
        bush.perc gore.perc browne.perc nader.perc harris.perc hagelin.perc
   Min.    0.3099    0.2409   0.0005908   0.006563  0.00000000    0.0000000
1st Qu.    0.5014    0.3679   0.0022170   0.012220  0.00002718    0.0002116
 Median    0.5490    0.4297   0.0029320   0.014540  0.00007643    0.0003131
   Mean    0.5533    0.4271   0.0032780   0.015840  0.00011430    0.0003586
3rd Qu.    0.6156    0.4759   0.0036290   0.018900  0.00013740    0.0004339
   Max.    0.7404    0.6753   0.0097010   0.037770  0.00102000    0.0012670
>var(cbind(bush.perc,gore.perc,browne.perc,nader.perc,harris.perc,hagelin.perc))
                  bush.perc      gore.perc    browne.perc     nader.perc    harris.perc   hagelin.perc
   bush.perc  8.539950e-003 -8.400036e-003  1.290400e-005 -1.517705e-004 -3.925380e-007 -6.553950e-007
   gore.perc -8.400036e-003  8.303500e-003 -1.847346e-005  1.141864e-004  5.515140e-007  2.716214e-007
 browne.perc  1.290400e-005 -1.847346e-005  2.678327e-006  2.888717e-006 -3.244831e-008  3.486386e-008
  nader.perc -1.517705e-004  1.141864e-004  2.888717e-006  3.454893e-005 -1.491483e-007  2.955648e-007
 harris.perc -3.925380e-007  5.515140e-007 -3.244831e-008 -1.491483e-007  2.746393e-008 -4.843283e-009
hagelin.perc -6.553950e-007  2.716214e-007  3.486386e-008  2.955648e-007 -4.843283e-009  5.818825e-008
>cor(cbind(bush.perc,gore.perc,browne.perc,nader.perc,harris.perc,hagelin.perc))
               bush.perc   gore.perc browne.perc nader.perc harris.perc hagelin.perc
   bush.perc  1.00000000 -0.99752291  0.08532274 -0.2794102 -0.02563142  -0.02940071
   gore.perc -0.99752291  1.00000000 -0.12387561  0.2131898  0.03652117   0.01235708
 browne.perc  0.08532274 -0.12387561  1.00000000  0.3003004 -0.11964071   0.08831329
  nader.perc -0.27941021  0.21318982  0.30030041  1.0000000 -0.15311572   0.20845761
 harris.perc -0.02563142  0.03652117 -0.11964071 -0.1531157  1.00000000  -0.12115489
hagelin.perc -0.02940071  0.01235708  0.08831329  0.2084576 -0.12115489   1.00000000
> bush.perc+gore.perc
 [1] 0.9539692 0.9909598 0.9825326 0.9867488 0.9762802 0.9851772 0.9901536 0.9758552 0.9719790 0.9863340
[11] 0.9823255 0.9786459 0.9767922 0.9764680 0.9851897 0.9823037 0.9814883 0.9769865 0.9884133 0.9720149
[21] 0.9788312 0.9813531 0.9862315 0.9848338 0.9853195 0.9745769 0.9819735 0.9752782 0.9835796 0.9779964
[31] 0.9888793 0.9834284 0.9863618 0.9806989 0.9769704 0.9776336 0.9700807 0.9856419 0.9879203 0.9747684
[41] 0.9754682 0.9794698 0.9898825 0.9621833 0.9863176 0.9812814 0.9839829 0.9826600 0.9806902 0.9848641
[51] 0.9724893 0.9704549 0.9851655 0.9808054 0.9826009 0.9713188 0.9815126 0.9761613 0.9800933 0.9835947
[61] 0.9806803 0.9902525 0.9870644 0.9814377 0.9784392 0.9809036 0.9839626 0.9713940
We see that the distribution of the four minor candidates is skewed to the right. The distance
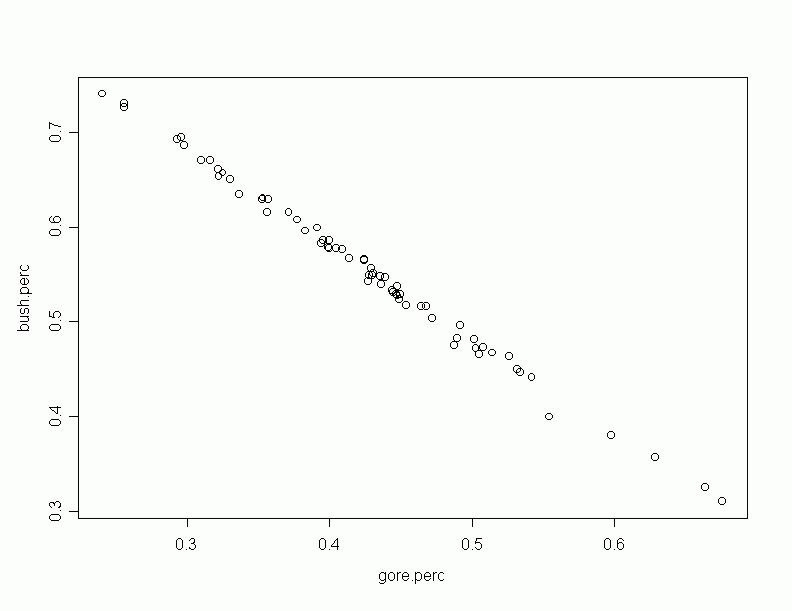
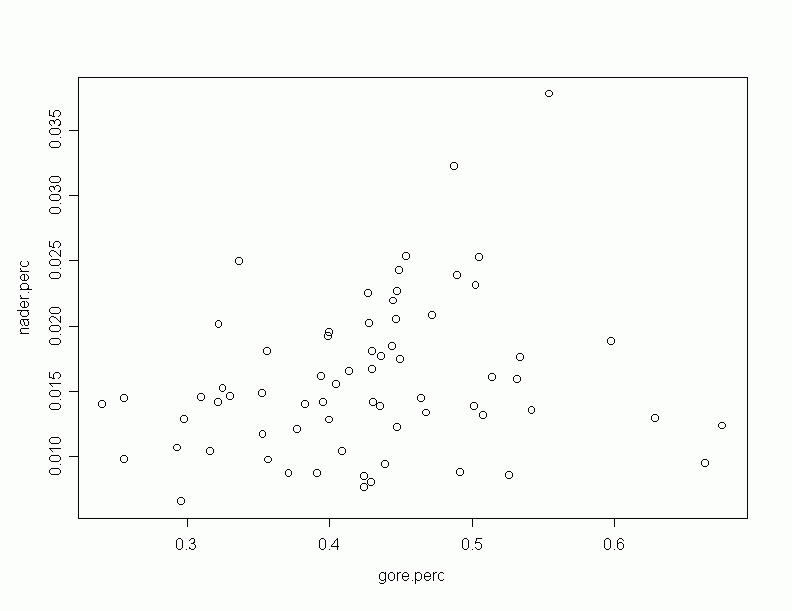
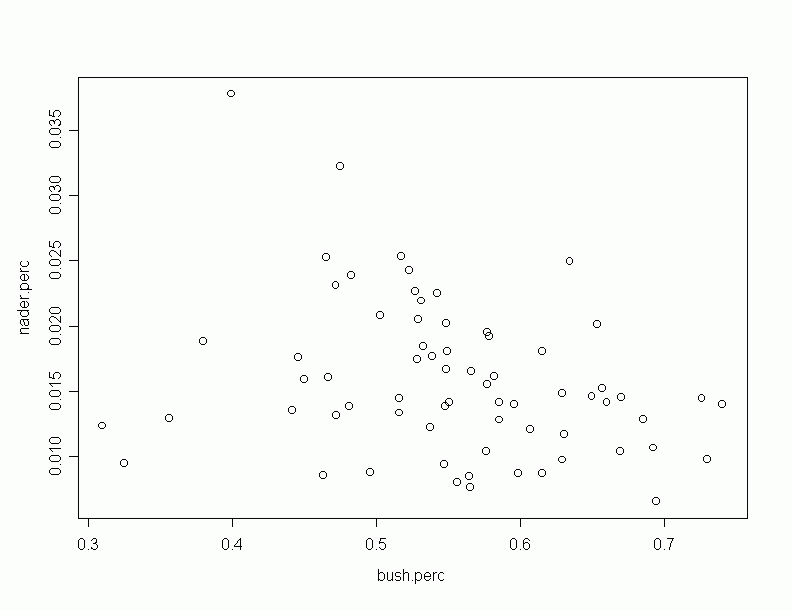
form the median to the maximum is bigger than the distance from the median to the minimum. The total percentage of these two candidates remain roughly constant. There exists a extreme negative correlation between the bush.perc and gore.perc. The total percentage of these two candidates remain roughly constant. In counties were Bush does better, Gore does worse and viceversa. We see that the correlation between gore.perc and nader.perc is negative, but moderately small. The correlation between bush.perc and nader.perc is positive but moderately small. Scatter plots of some pairs of variables follow:
> plot(gore.perc,bush.perc)
> plot(gore.perc,nader.perc)
> plot(bush.perc,nader.perc)

First, you need to have the cars datafile in your directory. To simplify, the notation, you do:
> weig_cars[,1]
> disp_cars[,2]
> mile_cars[,3]
To obtain the main numerical measure which describe the data, you do
> summary(mile)
 Min. 1st Qu. Median  Mean 3rd Qu. Max.
   18      21     23 24.58      27   37
> summary(weig)
 Min. 1st Qu. Median Mean 3rd Qu. Max.
 1845    2571   2885 2901    3231 3855
> summary(disp)
 Min. 1st Qu. Median Mean 3rd Qu. Max.
   73   113.8  144.5  152     180  305

> var(cbind(weig,disp,mile))
            weig        disp        mile
weig  245883.192  21573.3475 -2014.47740
disp   21573.347   2933.4042  -179.89407
mile   -2014.477   -179.8941    22.95904
> cor(cbind(weig,disp,mile))
           weig       disp       mile
weig  1.0000000  0.8032804 -0.8478541
disp  0.8032804  1.0000000 -0.6931928
mile -0.8478541 -0.6931928  1.0000000
We see that the distribution of the mileage is skewed to the right.
There are some cars with very high mileage. The distribution of the weights of the cars is
sort of symmetric. The displacement of the cars has also a distribution skewed to the right.
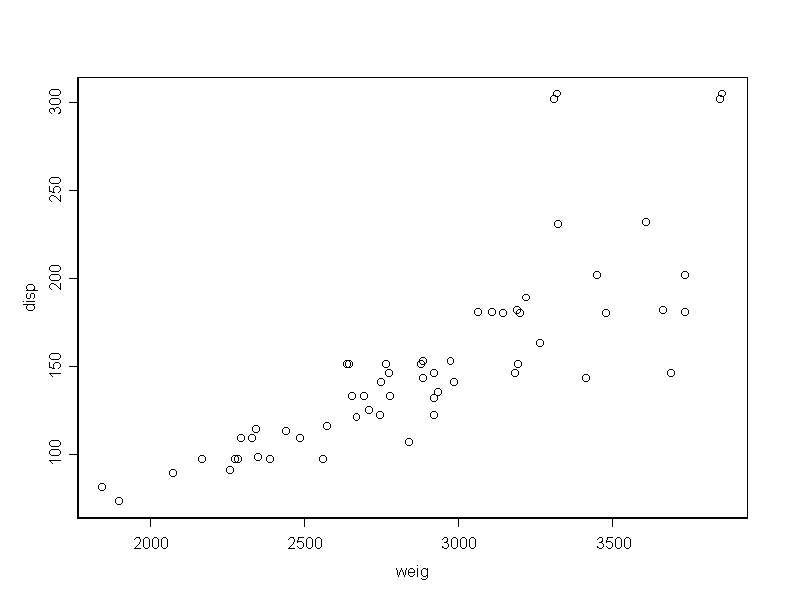
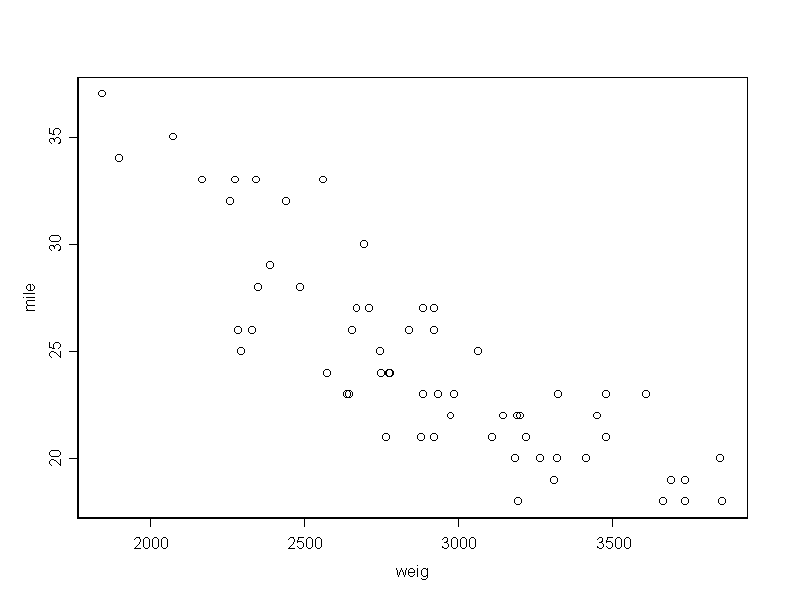
There is a high positive correlation between car weight and engine displacement and high negative correlation between weight and mileage. Certainly, these relations seem natural to happen.
Running the following program, we get tables:
***********c1****
table(mile)
table(weig)
bre.m_ 10+5*c(1:6)
table(cut(mile,breaks=bre))
table(cut(weig,breaks=5))/length(weig)
table(cut(disp,breaks=pretty(disp)))
hist(mile,plot=F)
hist(weig,nclass=7,plot=F,probability=T)
hist(disp,breaks=bre.d,plot=F)
table(cut(mile,breaks=pretty(mile)),cut(weig,breaks=pretty(weig)))
table(cut(mile,breaks=pretty(mile)),cut(disp,breaks=pretty(disp)))
table(cut(disp,breaks=pretty(disp)),cut(weig,breaks=pretty(weig)))
hist2d(mile,weig)
hist2d(mile,disp,xbreaks=bre.m,ybreaks=pretty(disp))
hist2d(disp,weig,nxbins=4,nybins=5)
*******************
This is the outcome of the program:
> table(mile)
 18 19 20 21 22 23 24 25 26 27 28 29 30 32 33 34 35 37
  4  3  5  6  5  8  4  3  5  4  2  1  1  2  4  1  1  1
> table(weig)
 1845 1900 2075 2170 2260 2275 2285 2295 2330 2345 2350 2390 2440 2485 2560 2575 2640 2645 2655 2670 2695
    1    1    1    1    1    1    1    1    1    1    1    1    1    1    1    1    1    1    1    1    1
 2710 2745 2750 2765 2775 2780 2840 2880 2885 2920 2935 2975 2985 3065 3110 3145 3185 3190 3195 3200 3220
    1    1    1    1    1    1    1    1    2    3    1    1    1    1    1    1    1    1    1    1    1
 3265 3310 3320 3325 3415 3450 3480 3610 3665 3690 3735 3850 3855
    1    1    1    1    1    1    2    1    1    1    2    1    1
>
> bre.m_ 10+5*c(1:6)
> table(cut(mile,breaks=bre))
 15+ thru 20 20+ thru 25 25+ thru 30 30+ thru 35 35+ thru 40
          12          26          13           8           1
> table(cut(weig,breaks=5))/length(weig)
 1824.90+ thru 2234.94 2234.94+ thru 2644.98 2644.98+ thru 3055.02 3055.02+ thru 3465.06
            0.06666667             0.2166667             0.3333333             0.2333333
 3465.06+ thru 3875.10
                  0.15
> table(cut(disp,breaks=pretty(disp)))
  50+ thru 100 100+ thru 150 150+ thru 200 200+ thru 250 250+ thru 300 300+ thru 350
            10            24            18             4             0             4
>
> hist(mile,plot=F)
$breaks:
 [1] 18 20 22 24 26 28 30 32 34 36 38

$counts:
 [1] 12 11 12  8  6  2  2  5  1  1

> hist(weig,nclass=7,plot=F,probability=T)
$breaks:
 [1] 1800 2000 2200 2400 2600 2800 3000 3200 3400 3600 3800 4000

$counts:
 [1] 0.0001666667 0.0001666667 0.0006666667 0.0003333333 0.0009166667 0.0008333333 0.0005833333 0.0004166667
 [9] 0.0003333333 0.0004166667 0.0001666667

> hist(disp,breaks=bre.d,plot=F)
$breaks:
[1]  50 100 150 200 250 300 350

$counts:
[1] 10 24 18  4  0  4

>
> table(cut(mile,breaks=pretty(mile)),cut(weig,breaks=pretty(weig)))
            1500+ thru 2000 2000+ thru 2500 2500+ thru 3000 3000+ thru 3500 3500+ thru 4000
15+ thru 20               0               0               0               6               6
20+ thru 25               0               1              14              10               1
25+ thru 30               0               5               8               0               0
30+ thru 35               1               6               1               0               0
35+ thru 40               1               0               0               0               0
> table(cut(mile,breaks=pretty(mile)),cut(disp,breaks=pretty(disp)))
             50+ thru 100 100+ thru 150 150+ thru 200 200+ thru 250 250+ thru 300 300+ thru 350
15+ thru 20             0             3             4             1             0             4
20+ thru 25             0            10            13             3             0             0
25+ thru 30             3             9             1             0             0             0
30+ thru 35             6             2             0             0             0             0
35+ thru 40             1             0             0             0             0             0
> table(cut(disp,breaks=pretty(disp)),cut(weig,breaks=pretty(weig)))
              1500+ thru 2000 2000+ thru 2500 2500+ thru 3000 3000+ thru 3500 3500+ thru 4000
 50+ thru 100               2               7               1               0               0
100+ thru 150               0               5              16               2               1
150+ thru 200               0               0               6              10               2
200+ thru 250               0               0               0               2               2
250+ thru 300               0               0               0               0               0
300+ thru 350               0               0               0               2               2
> hist2d(mile,weig)
$x:
[1] 17.5 22.5 27.5 32.5 37.5

$y:
[1] 1750 2250 2750 3250 3750

$z:
         1500 to 2000 2000 to 2500 2500 to 3000 3000 to 3500 3500 to 4000
15 to 20            0            0            0            2            5
20 to 25            0            0           13           13            2
25 to 30            0            6            8            1            0
30 to 35            1            5            2            0            0
35 to 40            1            1            0            0            0

$xbreaks:
[1] 15 20 25 30 35 40

$ybreaks:
[1] 1500 2000 2500 3000 3500 4000

> hist2d(mile,disp,xbreaks=bre.m,ybreaks=pretty(disp))
$x:
[1] 17.5 22.5 27.5 32.5 37.5

$y:
[1]  75 125 175 225 275 325

$z:
          50 to 100 100 to 150 150 to 200 200 to 250 250 to 300 300 to 350
15 to 20          0          1          3          1          0          2
20 to 25          0         10         13          3          0          2
25 to 30          3         10          2          0          0          0
30 to 35          5          3          0          0          0          0
35 to 40          2          0          0          0          0          0

$xbreaks:
[1] 15 20 25 30 35 40

$ybreaks:
[1]  50 100 150 200 250 300 350

> hist2d(disp,weig,nxbins=4,nybins=5)
$x:
[1]  75 125 175 225 275 325

$y:
[1] 1750 2250 2750 3250 3750

$z:
           1500 to 2000 2000 to 2500 2500 to 3000 3000 to 3500 3500 to 4000
 50 to 100            2            7            1            0            0
100 to 150            0            5           16            2            1
150 to 200            0            0            6           10            2
200 to 250            0            0            0            2            2
250 to 300            0            0            0            0            0
300 to 350            0            0            0            2            2

$xbreaks:
[1]  50 100 150 200 250 300 350

$ybreaks:
[1] 1500 2000 2500 3000 3500 4000
A more precise description of the distributions can be done, doing different graphs.
For example,
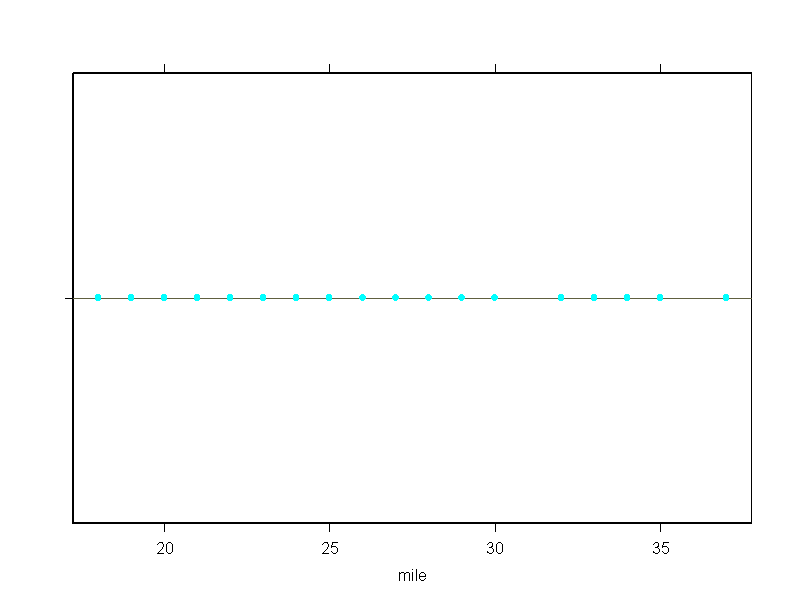
To do a dotplot:
> dotplot(mile)
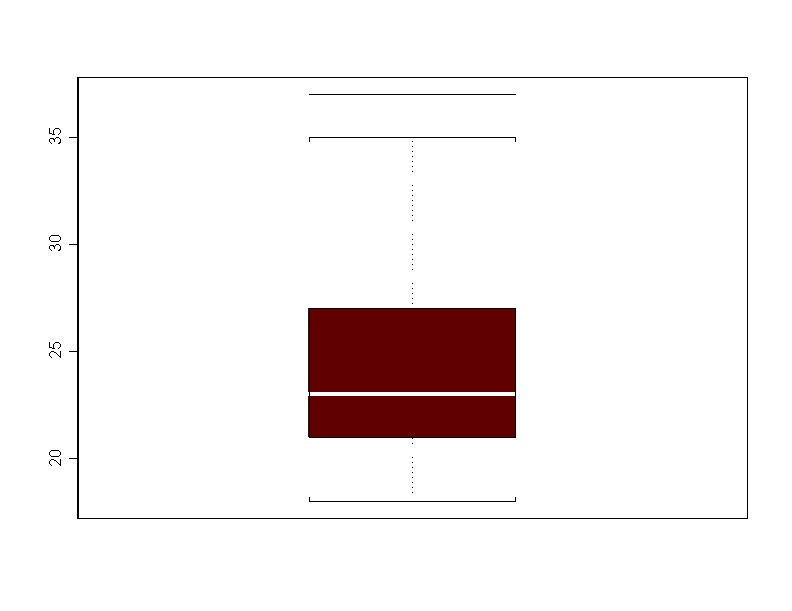
> boxplot(mile)
> stem(mile,scale=-1)

N = 60   Median = 23
Quartiles = 21, 27

Decimal point is 1 place to the right of the colon

   1 : 8888999
   2 : 00000111111
   2 : 2222233333333
   2 : 4444555
   2 : 666667777
   2 : 889
   3 : 0
   3 : 223333
   3 : 45
   3 : 7
To do a histogram:
> boxplot(mile)
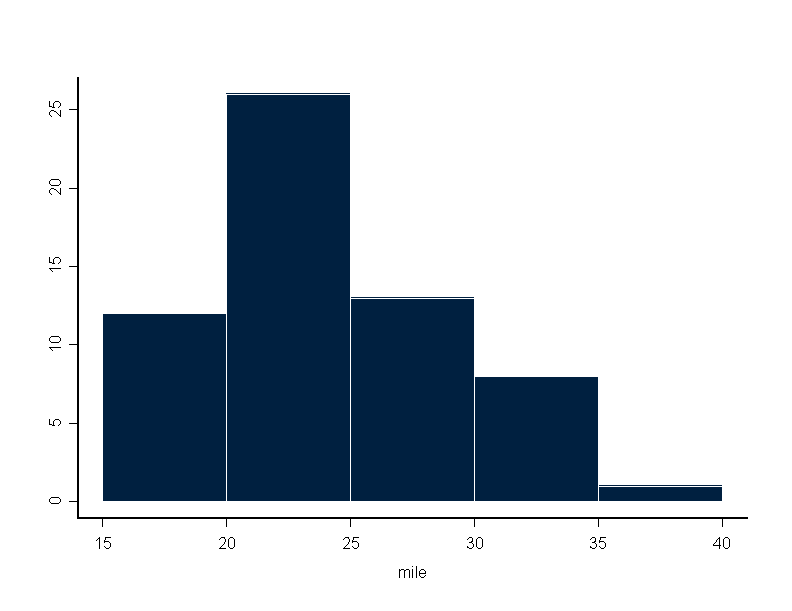
For example,
> hist(mile,breaks=bre, plot = F, probability = F)
$breaks:
[1] 15 20 25 30 35 40

$counts:
[1] 12 26 13  8  1
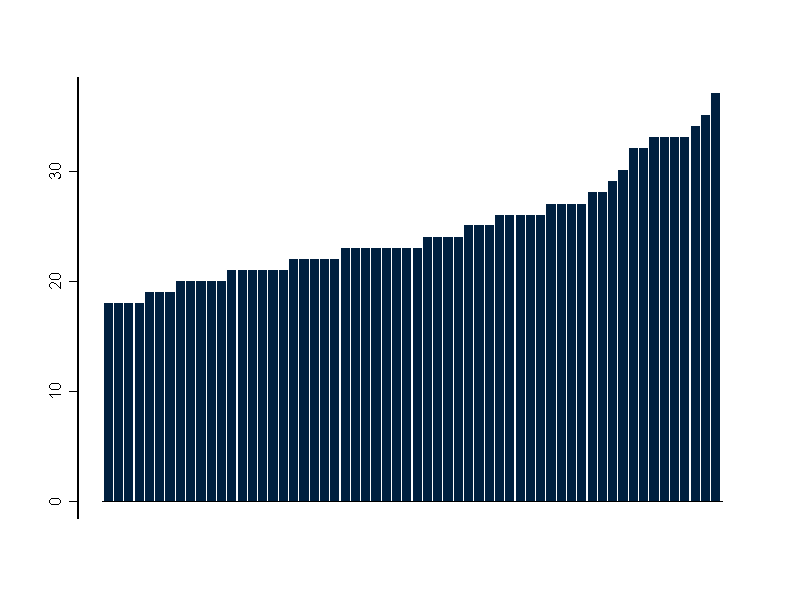
To do a barplot:
> barplot(mile)
> plot(weig,disp)
> plot(weig,mile)
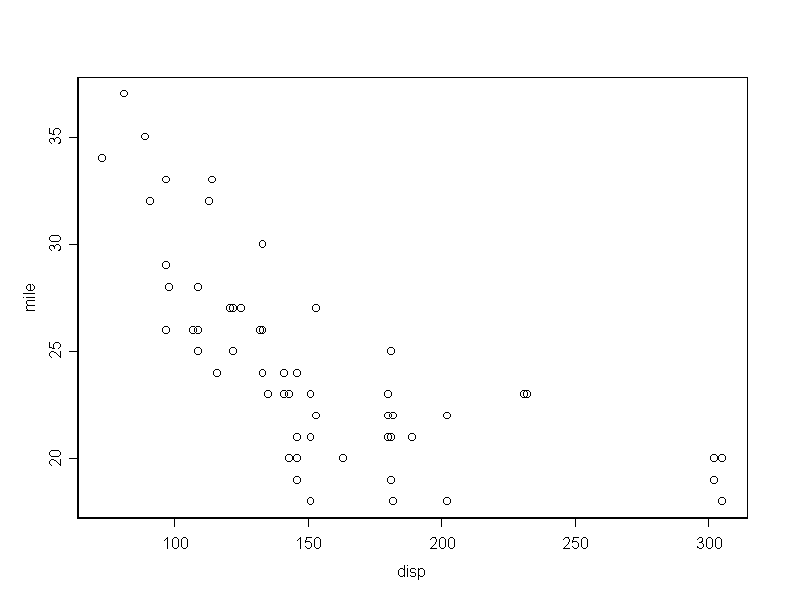
> plot(disp,mile)
