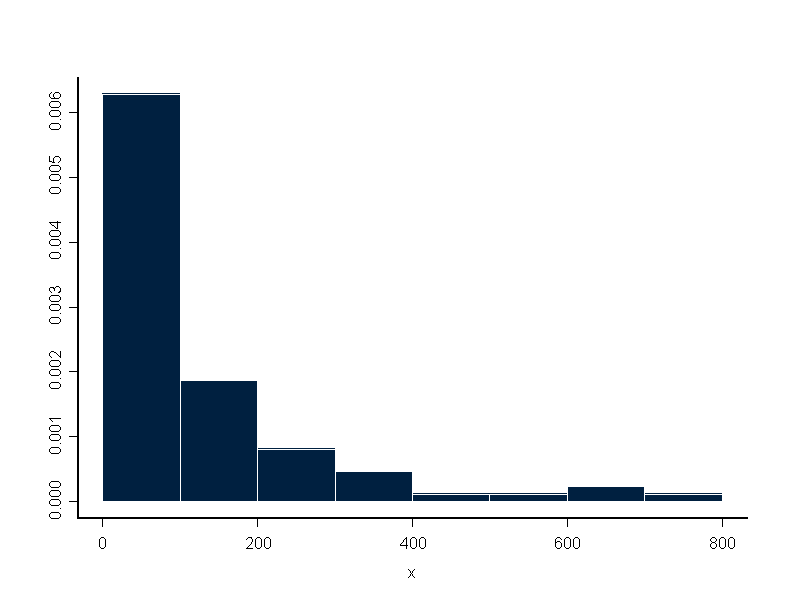
Splus has the following commands to do density estimation: hist, density,...
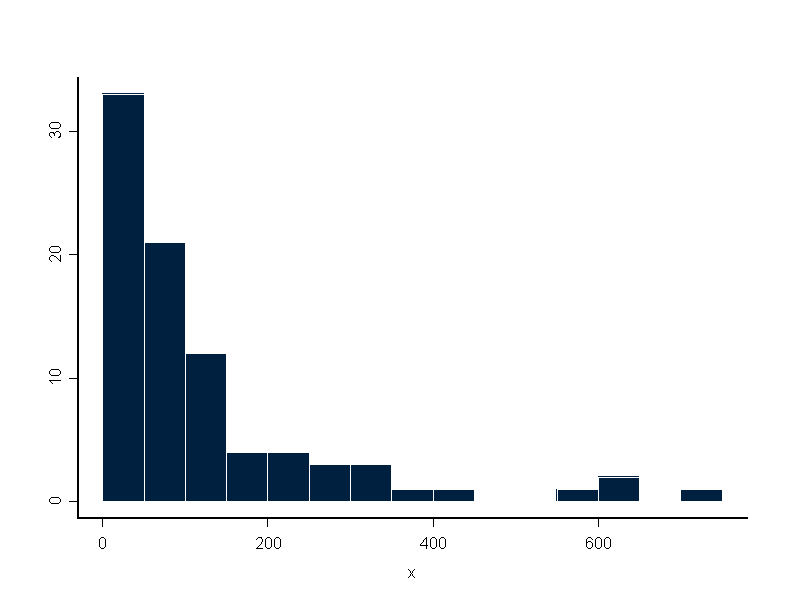
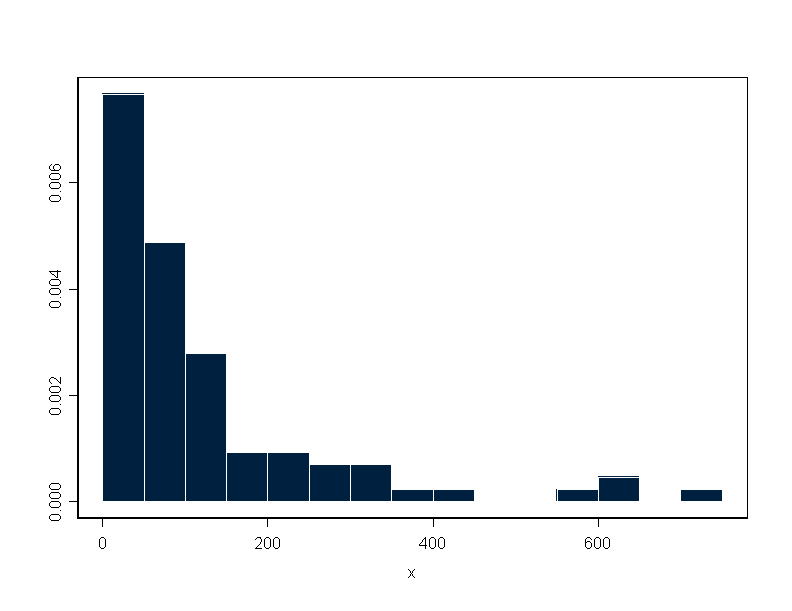
The command hist(x, nclass = , breaks = , plot = T, probability = F) allows to do count and probability histogram. It allows to obtain the points of the graph instead of the graph itself.
****** program 11a **********
# The data is the lengths of treatment spells in days of
# control patients in suicide study. The data is page 8 in
# Silverman (1986, Density Estimation for statistics and data analysis)

x_c(1,1,1,5,7,8,8,13,14,14,17,18,21,21,22,25,27,27,30,30,31,31,32,
+ 34,35,36,37,38,39,39,40,49,49,54,56,62,63,65,65,67,75,76,79,82,83,
+ 84,84,84,84,90,91,92,93,93,103,103,111,112,119,122,123,126,129,134,
+ 144,147,153,163,167,175,228,231,235,242,256,256,257,311,314,322,
+ 369,415,573,609,640,737)
y_c(0:8)*100
hist(x,breaks=y,plot=F,probability=T)
hist(x,breaks=y,plot=F,probability=F)
hist(x,breaks=y,probability=T)
hist(x,nclass=15)
n_length(x)
h_50
x0_0
first_floor((min(x)-x0)/h)
last_ceiling((max(x)-x0)/h)
binmesh_ x0+h*c(first:last)
hist(x,breaks=binmesh,probability=T,plot=T)
box()
midpoints_x0+h*c(first-0.5:last+0.5)
res_list(midpoints)
names(res)_c("midp")
res
****** outcome **********
> hist(x, breaks = y, plot = F, probability = T)
$breaks:
[1]   0 100 200 300 400 500 600 700 800

$counts:
[1] 0.0062790698 0.0018604651 0.0008139535 0.0004651163
[5] 0.0001162791 0.0001162791 0.0002325581 0.0001162791

> hist(x, breaks = y, plot = F, probability = F)
$breaks:
[1]   0 100 200 300 400 500 600 700 800

$counts:
[1] 54 16  7  4  1  1  2  1

******* program 11b ************************************
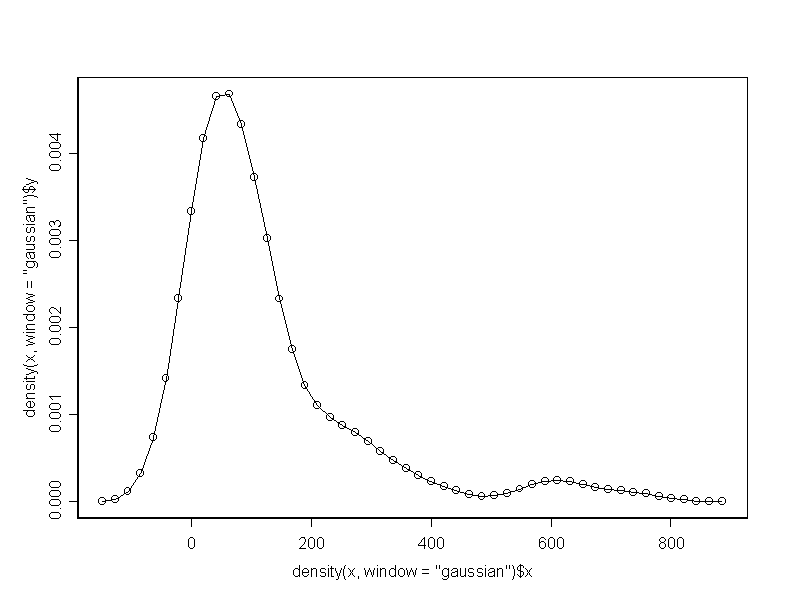
density(x, window="gaussian")
plot(density(x, window="gaussian"))
lines(density(x,window="gaussian"),type="l")
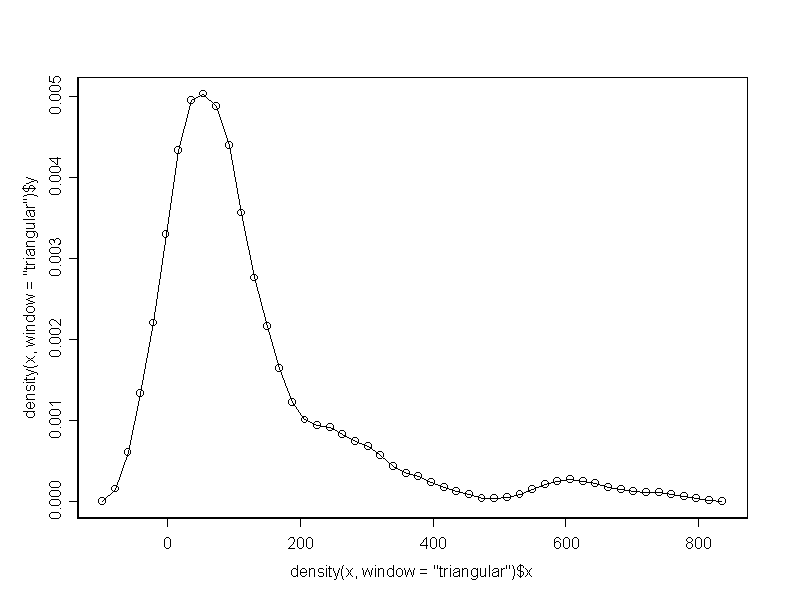
plot(density(x, window="triangular"))
lines(density(x,window="triangular"),type="l")
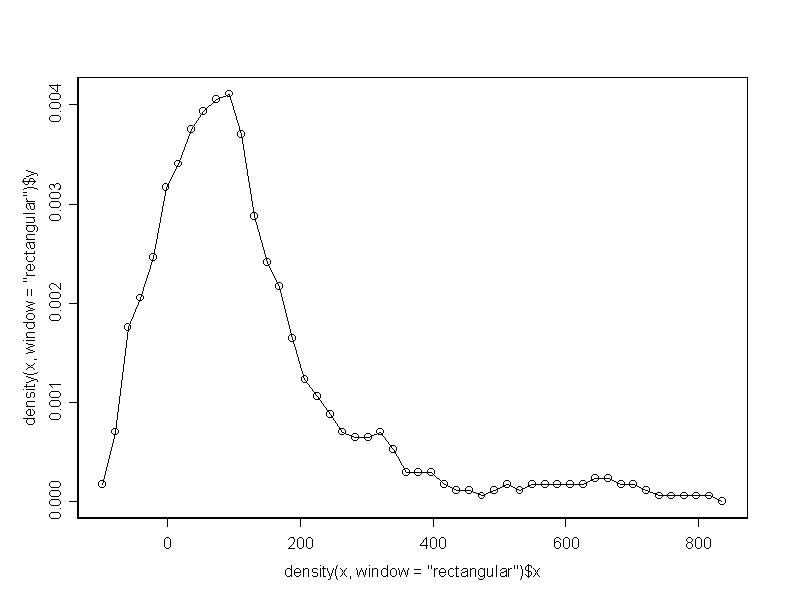
plot(density(x, window="rectangular"))
lines(density(x,window="rectangular"),type="l")
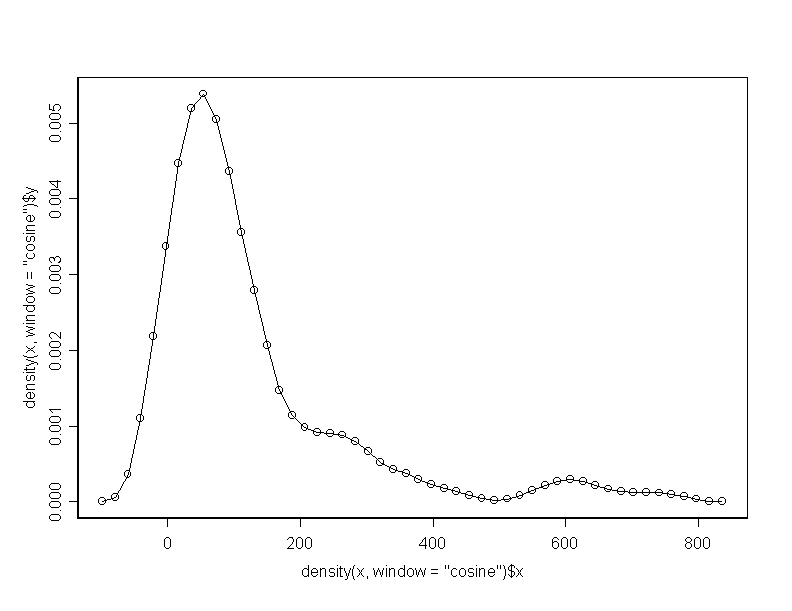
plot(density(x, window="cosine"))
lines(density(x, window="cosine"),type="l")
> density(x, window = "gaussian")
$x:
 [1] -147.66154608 -126.57331971 -105.48509333
 [4]  -84.39686696  -63.30864059  -42.22041422
 [7]  -21.13218785   -0.04396148   21.04426489
[10]   42.13249126   63.22071763   84.30894400
[13]  105.39717037  126.48539674  147.57362311
[16]  168.66184948  189.75007585  210.83830222
[19]  231.92652859  253.01475496  274.10298133
[22]  295.19120770  316.27943407  337.36766044
[25]  358.45588681  379.54411319  400.63233956
[28]  421.72056593  442.80879230  463.89701867
[31]  484.98524504  506.07347141  527.16169778
[34]  548.24992415  569.33815052  590.42637689
[37]  611.51460326  632.60282963  653.69105600
[40]  674.77928237  695.86750874  716.95573511
[43]  738.04396148  759.13218785  780.22041422
[46]  801.30864059  822.39686696  843.48509333
[49]  864.57331971  885.66154608

$y:
 [1] 3.127960e-006 3.133975e-005 1.223117e-004
 [4] 3.263483e-004 7.406927e-004 1.421240e-003
 [7] 2.339564e-003 3.338854e-003 4.179907e-003
[10] 4.655921e-003 4.687488e-003 4.333940e-003
[13] 3.729359e-003 3.022174e-003 2.332249e-003
[16] 1.752005e-003 1.339479e-003 1.102218e-003
[19] 9.702331e-004 8.814761e-004 7.932332e-004
[22] 6.898220e-004 5.791020e-004 4.763499e-004
[25] 3.846036e-004 3.046099e-004 2.359012e-004
[28] 1.752539e-004 1.248499e-004 8.384259e-005
[31] 6.416676e-005 7.037640e-005 9.945419e-005
[34] 1.465525e-004 1.956907e-004 2.338052e-004
[37] 2.464897e-004 2.323426e-004 2.006068e-004
[40] 1.663133e-004 1.407482e-004 1.247152e-004
[43] 1.102536e-004 9.016423e-005 6.587503e-005
[46] 4.043466e-005 2.126075e-005 9.327184e-006
[49] 3.414064e-006 0.000000e+000
