# Program 5b
# I take the data from  page 498 of the textbook.
# The following program does the following:
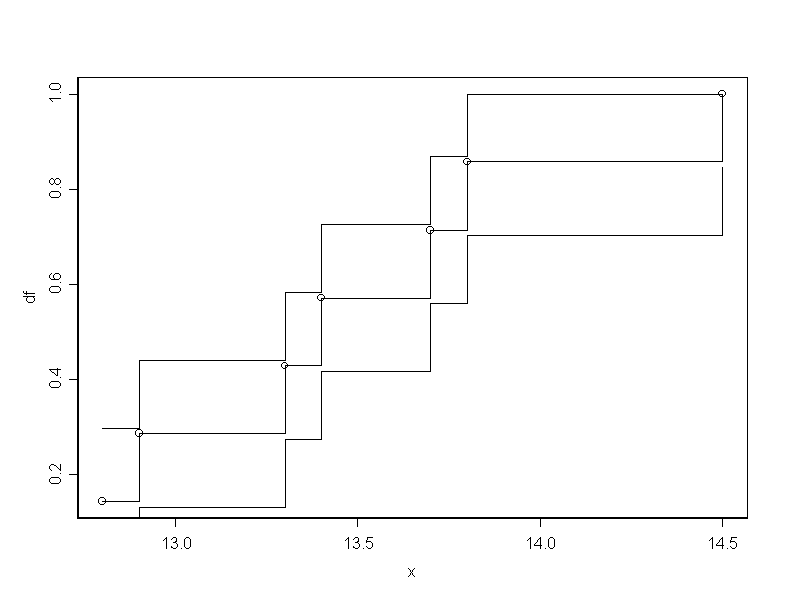
# 1. finds a confidence band for the distribution function.
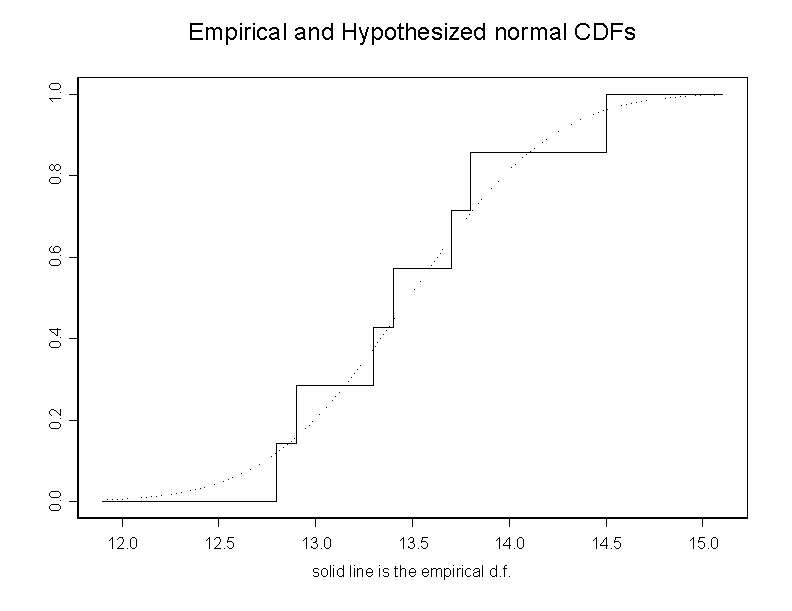
# 2. draws the empirical d.f. and the df of a N(14,2) using cd.compare
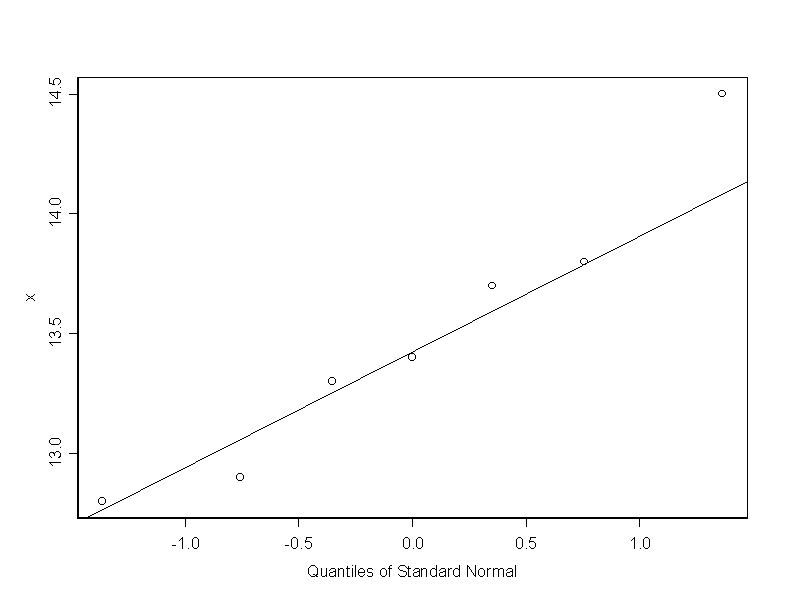
# 3. qq plots; quantiles from the data with respect to the normal quantiles.
# 4. Kolmogorov-Smironov test for Fo=N(14,2) using ks.gof
# 5. Kolmogorov-Smironov test for Fo=N(14,2) directly.

#x_c(42,43,51,61,66,69,71,81,82,82)
x_c(12.8,12.9,13.3,13.4,13.7,13.8,14.5)
# First we find the confidence band for the df.
x.sort_sort(x)
n_length(x)
df_c(1:n)/n
dalpha_0.409
plot(x,df)
df1_(df-(dalpha/sqrt(n)))
df1_pmax(df1,0)
df2_(df+(dalpha/sqrt(n)))
df2_pmin(df2,1)
for(i in 1:n){
segments(x.sort[i], df[i], x.sort[i+1],df[i])
segments(x.sort[i], df[i-1], x.sort[i],df[i])
segments(x.sort[i], df1[i], x.sort[i+1],df1[i])
segments(x.sort[i], df1[i-1], x.sort[i],df1[i])
segments(x.sort[i], df2[i], x.sort[i+1],df2[i])
segments(x.sort[i], df2[i-1], x.sort[i],df2[i])
}
# the following command compares the df of x with the df of
# normal r.v. with the parameters of x
cdf.compare(x, y = NULL, distribution = "normal",mean=mean(x),sd=stdev(x))
# next, we find the qq plot with respect to the normal quantiles
qqnorm(x)
qqline(x)
# we can do the Kolmogorov-Smirnov goodness of fitness test
ks.gof(x,y=NULL,alternative="two.sided",distribution="normal",mean=14,sd=2)
# we can find directly the Kolmogor-Smirnov statistic by doing:
x.sort_sort(x)
phi.x_pnorm(sort(x),mean=14,sd=2)
n_length(x)
df_c(1:n)/n
a_max(abs(df-phi.x))
b_max(abs(phi.x+(1/n)-df))
kolmo_max(a,b)
print(kolmo)
N_10000
ks_c(1:N)
df_c(1:n)/n
for(i in 1:N){
xa_runif(n,0,1)
xa_sort(xa)
a_max(abs(df-xa))
b_max(abs(xa+(1/n)-df))
ks[i]_max(a,b)
}
p.value.ks_sum(ks>kolmo)/N
print(p.value.ks)
The outcome of this program is
> ks.gof(x,y=NULL,alternative="two.sided",distribution="normal",m=14,sd=2)
	# we can find directly the Kolmogor-Smirnov statistic by doing:

	One-sample Kolmogorov-Smirnov Test
	Hypothesized distribution = normal

data:  x
ks = 0.4013, p-value = 0.1571
alternative hypothesis:
  True cdf is not the normal distn. with the specified parameters

> print(kolmo)
[1] 0.4012937
> print(p.value.ks)
[1] 0.1544

# program 5c
# We do the Lilliefort test of normality
# We use the data in  page 530 in the textbook.
x_c(12.8,12.9,13.3,13.4,13.7,13.8,14.5)
n_length(x)
xa_sort(x)
xa_(xa-mean(xa))/stdev(xa)
phi.x_pnorm(xa)
df_c(1:n)/n
a_max(abs(df-phi.x))
b_max(abs(phi.x+(1/n)-df))
lilli_max(a,b)
print(lilli)
N_10000
lilli.sim_c(1:N)
for(i in 1:N){
x_rnorm(n)
xa_sort(x)
xa_(xa-mean(xa))/stdev(xa)
phi.x_pnorm(xa)
df_c(1:n)/n
a_max(abs(df-phi.x))
b_max(abs(phi.x+(1/n)-df))
lilli_max(a,b)
lilli.sim[i]_max(a,b)
}
p.value.lilli_sum(lilli.sim>lilli)/N
print(p.value.lilli)
> print(p.value.lilli)
[1] 0.267
# program 5d
# We do the Wilks-Shapiro test of normality
# We use the data in  page 530 in the textbook.
x_c(12.8,12.9,13.3,13.4,13.7,13.8,14.5)
n_length(x)
xa_sort(x)
xa_xa-mean(xa)
phi_c(1:n)
phi_pnorm((phi-(1/2))/n)
corr_cor(xa,phi)
N_10000
sw_c(1:N)
corr.sim_c(1:N)
for(i in 1:N){
x2_rnorm(n)
x2a_sort(x2)
x2a_x2a-mean(x2a)
phi_c(1:n)
phi_pnorm((phi-(1/2))/n)
corr.sim[i]_cor(x2a,phi)
}
print(summary(corr.sim))
p.value.sw_sum(corr < corr.sim)/N
print(corr)
print(p.value.sw)
> print(p.value.sw)
[1] 0.5444
# program 5e
# I use the data in the Table 5.7, page 180 from the textbook.
# We want to compare the two df's
# We get the following:
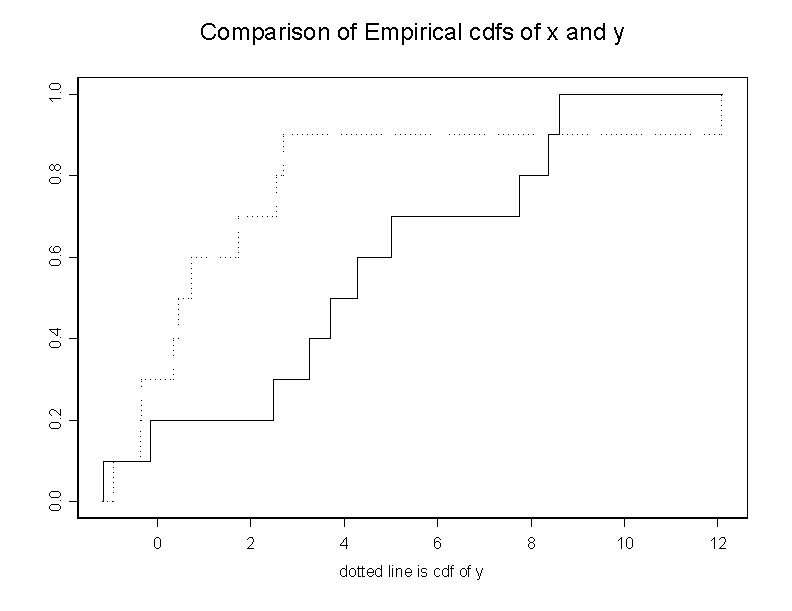
# 1. A graph with the two df's.
# 2. The Kolmogorov-Smirnov test
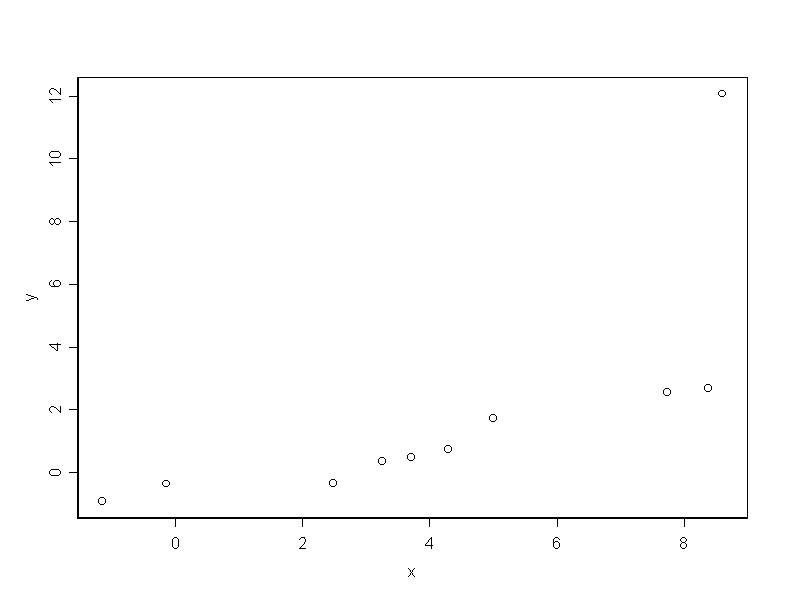
# 3. The qqplot.
#
x_c(-.15,8.6,5.,3.71,4.29,7.74,2.48,3.25,-1.15,8.38)
y_c(2.55,12.07,.46,.35,2.69,-.94,1.73,.73,-.35,-.37)
cdf.compare(x,y)
ks.gof(x,y)
qqplot(x,y)
The outcome of the program is
> ks.gof(x, y)

	Two-Sample Kolmogorov-Smirnov Test

data:  x and y
ks = 0.6, p-value = 0.0524
alternative hypothesis:
  cdf of x does not equal the
              cdf of y for at least one sample point.
Here are the graphs.
