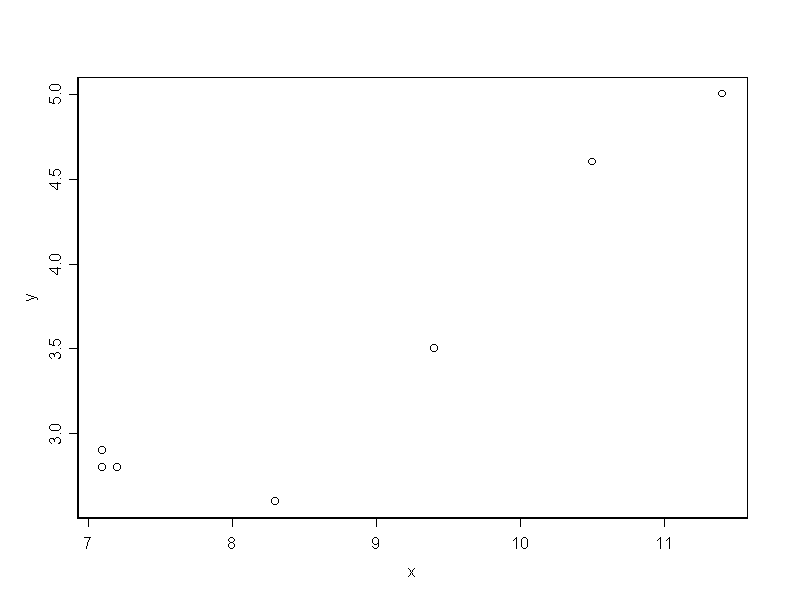
We can do 3 different test for independence using the command: cor.test. We use the data in Table 8.9 (page 396) of the textbook.
****** program 8a **********
x_c(7.1,7.1,7.2,8.3,9.4,10.5,11.4)
y_c(2.8,2.9,2.8,2.6,3.5,4.6,5.0)
plot(x,y)
cor.test(x, y, alternative="two.sided", method="pearson")
cor.test(x, y, alternative="two.sided", method="spearman")
cor.test(x, y, alternative="two.sided", method="kendall")
Next, we see the outcome of the previous script file.
The graph of x versus y is:

This is the outcome of the tests:
> cor.test(x, y, alternative = "two.sided", method ="pearson")

	Pearson's product-moment correlation

data:  x and y
t = 5.8826, df = 5, p-value = 0.002
alternative hypothesis: true coef is not equal to 0
sample estimates:
       cor
 0.9347468

> cor.test(x, y, alternative = "two.sided", method ="spearman")

	Spearman's rank correlation

data:  x and y
normal-z = 1.6709, p-value = 0.0947
alternative hypothesis: true rho is not equal to 0
sample estimates:
 rho
 0.7

> cor.test(x, y, alternative = "two.sided", method ="kendall")

	Kendall's rank correlation tau

data:  x and y
normal-z = 1.6897, p-value = 0.0911
alternative hypothesis: true tau is not equal to 0
sample estimates:
       tau
 0.5238095
The Pearson's test reejcts the null hypothesis. However, the
Spearman's and Kendall's tests accept the null hypothesis.
The sample size is not very big.
